Smart Money Zones (FVG + OB) + MTF Trend Panel## Overview
Professional-grade institutional trading zones indicator that identifies **Fair Value Gaps (FVG)** and **Order Blocks (OB)** - key price inefficiencies where smart money operates. Includes a comprehensive **Multi-Timeframe Trend Panel** for complete market context at a glance.
## Core Features
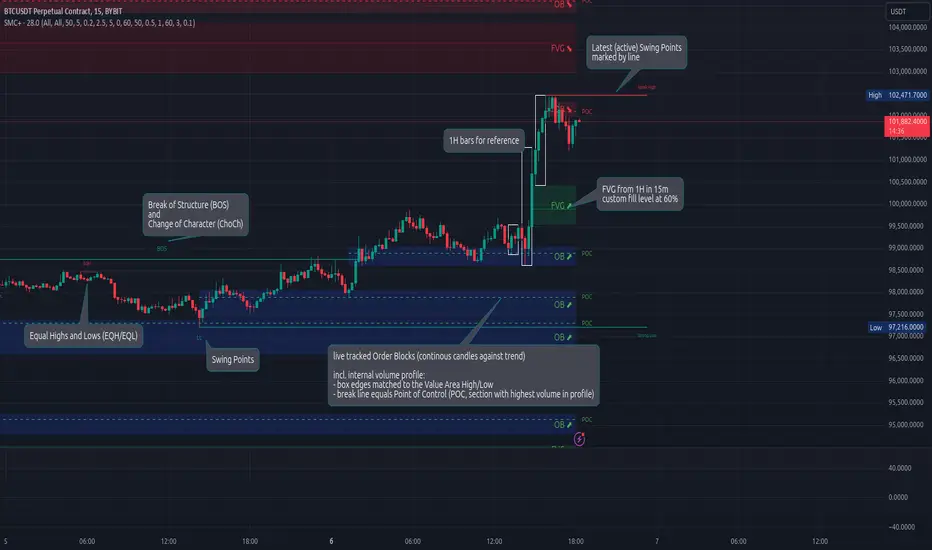
### 🎯 Fair Value Gaps (FVG)
Fair Value Gaps occur when price moves so aggressively that it leaves an "imbalance" or "gap" in the market structure. These zones often act as magnets where price returns to find liquidity.
**Detection Logic:**
- **Bullish FVG**: When current candle's low is above the high of the candle 2 bars ago
- **Bearish FVG**: When current candle's high is below the low of the candle 2 bars ago
- Requires strong impulse candle (configurable body percentage threshold)
- Color-coded zones: Green for bullish, Red for bearish
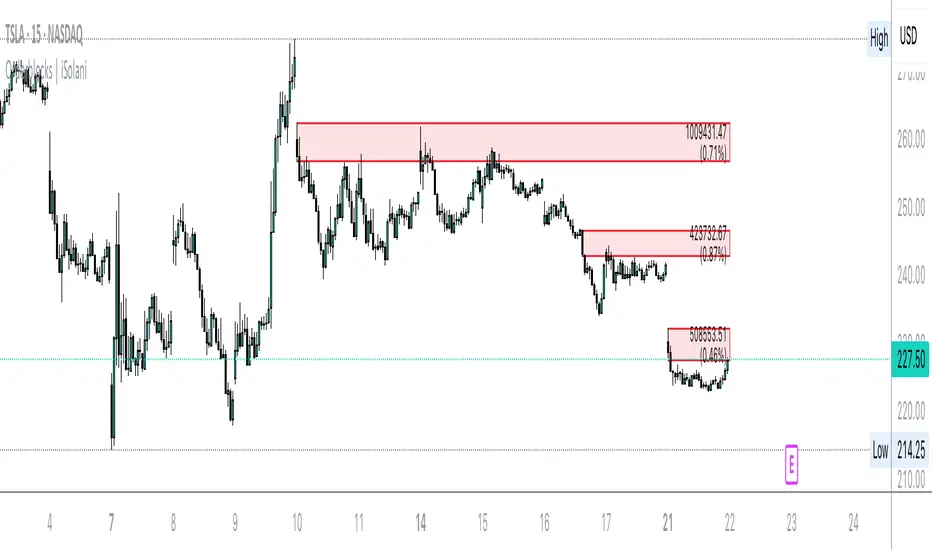
### 📦 Order Blocks (OB)
Order Blocks represent the last opposite candle before a significant price move - the zone where institutional orders were placed before the breakout.
**Detection Logic:**
- Identifies the last bearish candle before a strong bullish breakout (Bullish OB)
- Identifies the last bullish candle before a strong bearish breakout (Bearish OB)
- Validates breakout strength using ATR multiplier (1.2x default)
- Color-coded zones: Blue for bullish, Orange for bearish
### 📊 Multi-Timeframe Trend Panel
Real-time trend analysis across **7 timeframes** displayed in an elegant dashboard:
- **1 Minute** - Ultra short-term scalping
- **5 Minutes** - Short-term momentum
- **15 Minutes** - Intraday swings
- **30 Minutes** - Session trends
- **1 Hour** - Multi-session trends
- **4 Hours** - Daily structure
- **Daily** - Long-term direction
**Visual Indicators:**
- 🟢 Green circle = Bullish trend
- 🔴 Red circle = Bearish trend
- Clean, professional table design with customizable position and size
## Intelligence Features
### 🧠 Zone Strength Rating
Every zone is automatically classified by strength based on size relative to ATR:
- **VERY STRONG** - 2.0x ATR or more (major institutional zones)
- **STRONG** - 1.5x to 2.0x ATR (significant zones)
- **MEDIUM** - 1.0x to 1.5x ATR (moderate zones)
- **WEAK** - Below 1.0x ATR (minor zones)
Strength rating helps you prioritize which zones to trade from!
### 📉 Smart Mitigation Tracking
Zones automatically track how much they've been "filled" or mitigated:
- Calculates penetration percentage as price enters the zone
- Zones turn **gray** when 50%+ mitigated or fully filled
- Option to **auto-delete** mitigated zones to keep chart clean
- Live zones extend dynamically with price action
### 🎨 Trend Filter (Optional)
When enabled, only shows zones aligned with the current trend:
- Uses customizable MA period (default 50)
- Bullish zones only appear in uptrend
- Bearish zones only appear in downtrend
- Reduces noise and false signals significantly
## Customization Options
### Display Settings
- Toggle FVGs and OBs independently
- Adjust max zones per type (5-200)
- Choose to remove or gray out mitigated zones
- Color customization for all zone types
### Detection Parameters
- **Min Impulse Body %**: Controls how strong the impulse candle must be (0.3-1.0)
- **Order Block Lookback**: How many bars to look back for OB validation (5-50)
- **ATR Length**: Period for ATR calculation (5-50)
### Trend Filter
- Enable/disable trend filtering
- Adjustable MA period for trend determination
### MTF Panel
- Show/hide the trend panel
- 4 position options: Top Right, Top Left, Bottom Right, Bottom Left
- 3 size options: Small, Normal, Large
- Customizable MA period for trend calculation across all timeframes
## Trading Applications
### 1. **Liquidity Grab Entries**
Wait for price to sweep a zone (50%+ mitigation) then enter on reversal. Smart money often "hunts" these zones before the real move begins.
### 2. **Confluence Trading**
Look for zones that align with:
- Multiple timeframe trends showing same direction
- Multiple FVGs/OBs stacking in same area
- Key support/resistance levels
### 3. **Breakout Confirmation**
Use Order Blocks to confirm the strength of breakouts. Strong OBs indicate institutional participation.
### 4. **Retracement Entries**
Enter when price returns to a fresh, unmitigated zone in the direction of the higher timeframe trend.
### 5. **Range Trading**
Identify FVG zones at range extremes - price often reverses at these inefficiencies.
## How It Works
**Fair Value Gaps** form when the middle candle creates such aggressive movement that it leaves a price gap between the high/low of surrounding candles. Institutional traders know these gaps get filled.
**Order Blocks** mark the origin of major moves. The last opposite-colored candle before a breakout is where large orders were placed. Price often returns to these zones for "retests" before continuing.
**Mitigation** happens when price returns to fill these zones. The indicator tracks this automatically, showing you which zones are still "fresh" and which have been used up.
## Best Practices
✅ **Use higher timeframe trends** - Always check the MTF panel before taking trades
✅ **Trade fresh zones** - Unmitigated zones (not gray) have the highest probability
✅ **Combine with price action** - Look for rejection wicks and engulfing candles at zones
✅ **Respect zone strength** - VERY STRONG and STRONG zones are most reliable
✅ **Use trend filter** - Especially on lower timeframes to reduce false signals
❌ **Don't overtrade** - Not every zone will react, wait for confirmation
❌ **Don't ignore context** - Check the MTF panel for conflicting trends
❌ **Don't chase** - Wait for price to come to the zone, don't enter mid-zone
## Technical Details
- **Non-repainting**: All zones are drawn on confirmed candles only
- **Performance optimized**: Uses efficient array management with per-type caps
- **Real-time updates**: Zones extend and track mitigation as price moves
- **Universal compatibility**: Works on all markets and timeframes
## Recommended Settings by Style
**Scalping (1m-5m charts):**
- Max zones: 10-15
- Use trend filter: ON
- MTF Panel: Focus on 1m-15m trends
- Remove mitigated: ON (keep chart clean)
**Day Trading (5m-1H charts):**
- Max zones: 15-20
- Use trend filter: ON
- MTF Panel: Focus on 15m-4H trends
- Remove mitigated: OFF (track zone history)
**Swing Trading (1H-D charts):**
- Max zones: 20+
- Use trend filter: Optional
- MTF Panel: Focus on 1H-1D trends
- Remove mitigated: OFF (important zones persist)
---
## Perfect For
- Smart Money Concept (SMC) traders
- ICT methodology followers
- Institutional order flow traders
- Price action traders seeking key zones
- Multi-timeframe analysis enthusiasts
**Compatible with all markets:** Forex, Crypto, Stocks, Indices, Commodities, Futures
*Trade where the institutions trade. Follow the smart money.*
Индикатор Pine Script®